Mentoring Strategies at the
RIPLRT Institute

As stated by Ruslan Fomenko in a mentoring blog, “A mentor is someone who allows you to see the hope inside yourself” (by Oprah Winfrey). Shandra Bellinger further elaborates that there are different types of mentors (and different circumstances merit different mentoring styles), and mentoring is also a two-way street. Not only mentees but also mentors need to understand this inter-engaging relationship for mentoring to be effective and successful.
Where do we employ mentorship?
-
In the laboratory setting, scientific research employs a plethora of laboratory techniques. These techniques include routine (e.g. pipetting, preparation of solutions, environmental sample collection, and extractions, collection of human samples, etc.) and non-routine approaches (e.g. ELISA, Western blots, DNA and protein extractions, flow cytometry, "omics" technologies, human whole blood pyrogen essay, etc.). The RIPLRT maintains Standard Operational Procedures (SOPs), and mastering these techniques and approaches is key to the weekly and project-specific activities we employ. Also, veteran members (not only the PI) in the RIPLRT are eager to mentor in routine and innovative techniques.
-
Experimental Planning, Design, and Execution. Do to the many experiments and projects we participate throuhgout the year, planning and designing experiments is essential (see figure below). Different projects, even if they involve similar experimental techniques, need to be planned and designed. The experimental planning includes, but is not limited to identifying the availability of resources (i.e. inventory control), creating sample maps (for storage and experiments in microplates), identifying timeslots to carryout experiments, among others. The experimental design includes, but is not limited to identifying techniques suitable to address the experimental question, calculating sample sizes, and determining necessary statistical methods, among others. Planning and designing experiments not only benefits time management but also helps assign tasks, and intra-lab resources, and contributes to the project management (discussed below) to deliver experimental outcomes in a timely and reproducible manner. It is very rewarding to plan experiments, and even more rewarding when seeing the outcomes as a result of the planning and designing experiments.
-
To yield reproducibility, documentation throughout the different stages of an experiment is fundamental. In the RIPLRT, we have developed approaches to implement rigorous and transparent experimental documentation, including electronic notebooks, and cloud storage, among others. We also implement internal audits to monitor and improve our documentation. Meticulous documentation helps identify where a mistake was committed, learn from this mistake, and limit this mistake from happening in future instances. Furthermore, if we want others to learn from what we have done in the past, proper documentation is fundamental. Therefore, reproducibility, learning, and limiting mistakes benefit from taking great care in documenting during all stages of experiments.
-
In the vast majority of cases, the experiments we implement in RIPLRT are linked to a project. Within a project, there are different tasks' epicycles (see figure below) that vary in duration, efforts, and resources. Here is were project planning and management comes into play to remain on track with deadlines, efforts, and resources we input into a project. When a new project is to be launched, we come together to plan, for example, which tasks are needed, allocate personnel and material resources, and determine the duration and sequence of the tasks. Unless otherwise stated, in RIPLRT we practice with hard deadlines for each task. As a project moves forward, we need to keep in check that every task is being performed as planned, or close to plan, initially. Therefore, project planning and management skillset come in handy when concurrent projects are occurring in our working place and different deadlines are on the agenda.
-
How much a project will cost and implementing strategies to control how much we spend is another benefit of project planning and management (discussed above). As scientists, and pretty much in our daily lives, understanding how much needs to be spent (without under or overspending) is extremely important to carry out projects in the lab. Also, experimental planning and design help control the inventory of consumables and specific reagents thus different areas in which we mentored benefit the handling of budgets and inventories. In RIPLRT, we are cautious with how much need to me spend for an experiment or project, and take care of our man-hours and material resources needed without interfering with our work-life balance.
-
A scientific finding that is not communicated, or informed incorrectly, is a finding not discovered and one that missed the opportunity to contribute to society. In the RIPLRT, we constantly seek to find opportunities to communicate our scientific findings (e.g. manuscripts, poster presentations at conferences, blogs, etc), and take care to align these findings with regard to how they benefit public health and society as a whole. The scientific writing also benefits from the project planning and management (discussed above), and from the intra-collaboration (see teamwork below) within the RIPLRT. Becoming a good and efficient scientific writer takes a lot of work, effort, and patience -- it is rewarding when we become skillful at communicating our science.
-
Among the challenging skillsets as scientists are to become competitive in writing grants. The scientific aspect of grant writing involved many different phases and epicycles (see the figure below), including (but not limited to) 1) identifying an innovative and relevant idea, 2) matching this idea to appropriate experimental methods, 3) elaborating how expected outcomes will benefit society, 4) discussing what will be future directions after a proposed project is completed, 5) and convince peers that your proposed project should be the one funded and that your team (or group of collaborators) is fit to carry out the project. In addition to communicating all of the above in a scientific-concise manner, budget, project planning, and other aspects (some already discussed above) come into play. Therefore, in the RIPLRT we continuously seek to identify grant opportunities and ideas that fit these funding opportunities to deploy our scientific and mentoring efforts.
-
In recent years, there has been increasing scrutiny on the statistics behind scientific findings. Furthermore, many peer-reviewed journals and funding organizations (both government and private-non-profit) seek that the statistical methods be reproducible. These two requirements benefit from the implementation of computational approaches to handle, analyze, and extract meaning from datasets. In the RIPLRT, we have extensive expertise in data management and analysis, including in integrating the epicycles of data sciences. Given that this skill set has a steep learning curve, mentoring in this area takes planning and lots of patience -- and the mentee to not be afraid of errors when writing computational codes.
-
You'll be impressed with the increasing interest of society (often the one funding research through taxes) in scientific findings. However, we (as scientists) often fail in how properly downgrading the tone and terminology to help the non-scientific audience understand the benefits and meaning of the science we do. For this reason, mentoring in RIPLRT include writing blogs for a non-scientist audience on topics that are relevant to public health and which can provide insights on how to improve human health.
-
The peer-review process in scientific research is extremely important for the following reason: subjects scholarly work and research to the scrutiny of other experts to reassure its validity and suitability for publication. Although this is one of the areas of scientific research for which scientists are less rewarded, it is extremely important to move science forward. In RIPLRT, whenever the PI gets invited or identifies a peer-review opportunity, he invites members of the research team to practice peer-reviewing manuscripts and other scholarly work submitted by others.
-
Science is not an individual sport, and every scientist needs to either have, be involved, or collaborate with a research team. Nowadays funding agencies and non-profit organizations rarely fund scientific projects in which only one person is involved. From the beginning of the RIPLRT, we have been involved in collaborative projects, including projects addressing respiratory health in the aftermath of Hurricane Maria. As mentioned above in project planning and management, different resources of manpower within the RIPLRT are integrated into different tasks. Also, we have created an environment within RIPLRT in which collaborating is one of the key assets to be part of our research team
-
Transparency with ourselves and within the RIPLRT are among the priority of the group (click for the communication section in our lab manual). For this reason, we take great pride to have excellent lines of communication, even in today's technological area. Everyone in the RIPLRT knows what everyone is doing, and lines of communication are open within the RIPLRT.
-
In the RIPLRT, our principal investigator is not the only leader: everyone is given the opportunity to showcase and polish their leadership skills. That’s why our core value includes to “nourish from a culture of intra- and inter-motivation and inspiration.”
-
To move forward in our professional and personal (yes, we must have personal) goals, we must plan the steps we take to reach those milestones. Also, our principal investigator and mentor (Dr. Rivera-Mariani) has among his priority to see each person who goes through RIPLRT, and takes advantage of the many learning and growth opportunities presented, to triumph in their professional and personal endeavors. Dr. Rivera-Marian establishes periodic meetings with each member to follow upon the previous discussion on career planning and to identify areas and skillsets to master. Also, within the RIPLRT we exchange experiences that could contribute to the careers of others in the research team.

Mastering lab techniques is key for reliable results. Source https://www.illumina.com/techniques.html.

Pathways of planning, designing, and deploying an experiment. Source http://umich.edu/~essen/html/07chap/html/05prof2.htm.

Phases of Project Planning and Management.
Source https://www.smartsheet.com/blog/demystifying-5-phases-project-management.

How budget touches every stage of a scientific research project. Although the illustratino above describes a scientific project in general, it does highlights the importance of budget in each stage, including in its planning.

Tips for Structured Scientific Writing.
Source https://journals.plos.org/ploscompbiol/article?id=10.1371/journal.pcbi.1005619.

Grant writing pipeline.
Source https://writingcenter.unc.edu/tips-and-tools/grant-proposals-or-give-me-the-money/.
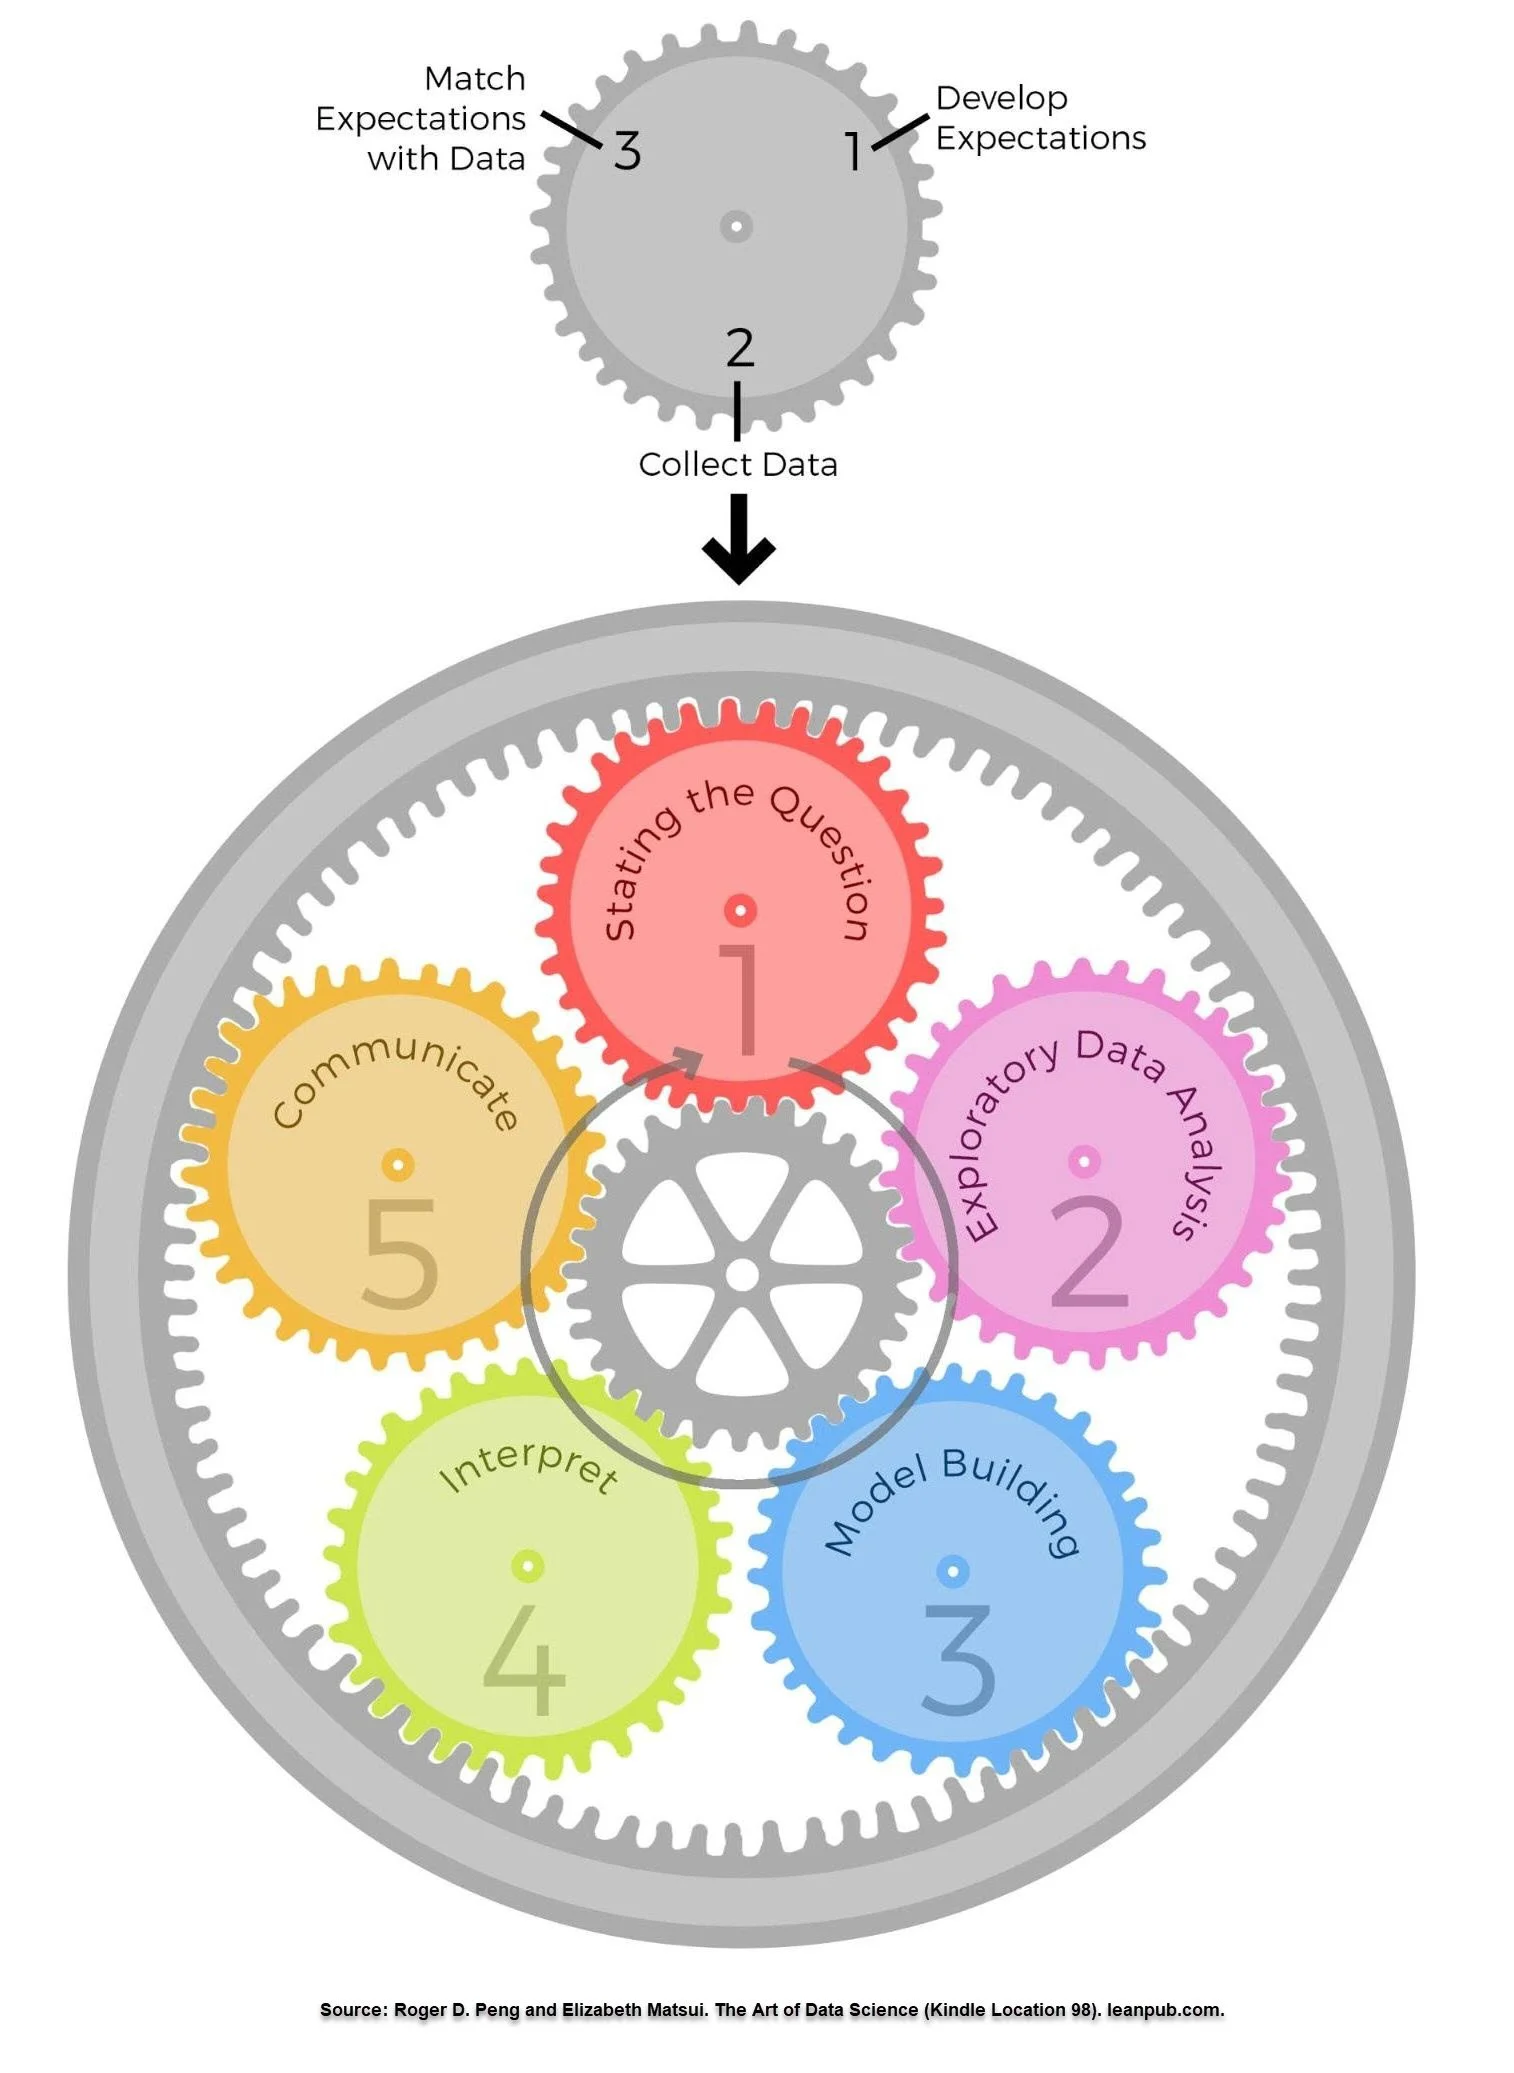
Epicycles of Data Science.
Source https://bookdown.org/rdpeng/artofdatascience/epicycles-of-analysis.html.

Science has to be communicated to society--otherwise, its impact is worthless.

The Peer-Review process.

Teamwork is essential in a research lab.
Source https://www.utoronto.ca/news/space-force-can-design-research-space-facilitate-collaboration.

We must take great pride to have excellent lines of communication, even in today's technological area.

Our core values in the RIPLRT emphasize in nourish from a culture of intra- and inter-motivation and inspiration.

It also takes effort to plan our careers.
Source leadership-skills-to-accelerate-performance-infographic-ccl-center-for-creative-leadership.